
Dashboards
Tableau dashboards your leadership actually opens.
You tell me what it has to answer and who reads it. I build it on your data and hand it over so your team can keep it running.
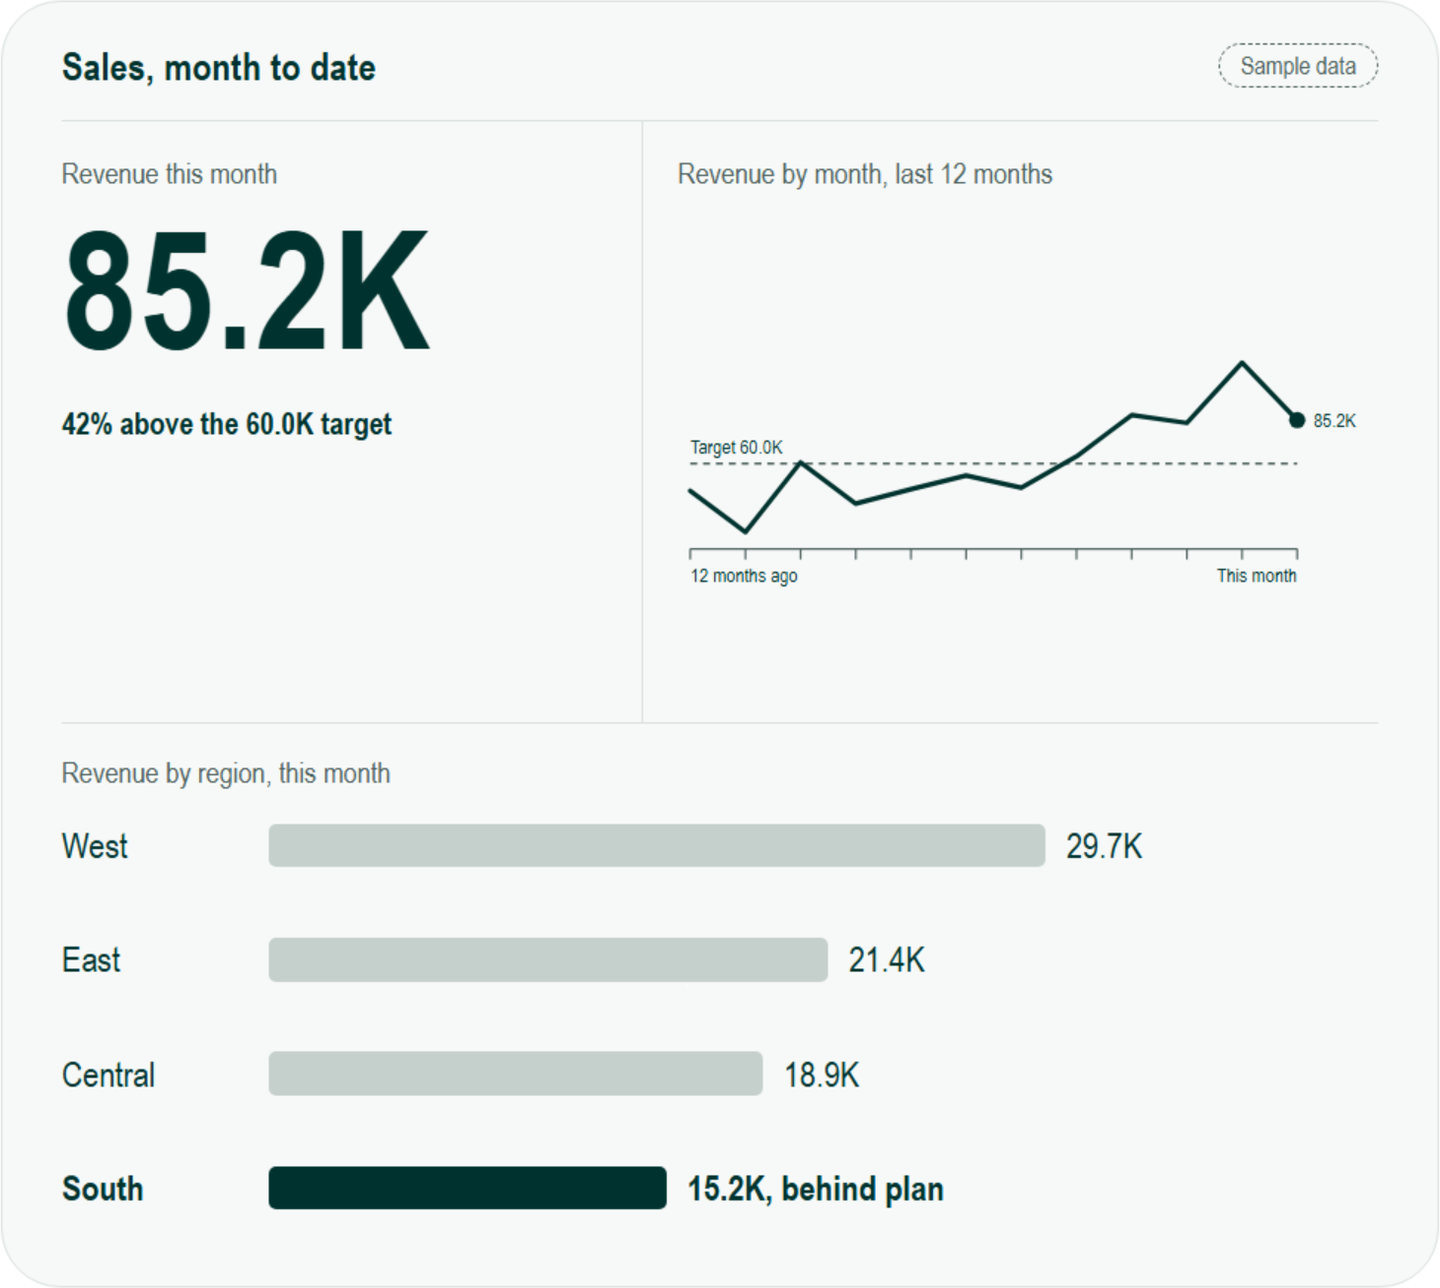
How I lay out a screen for leadership
Each number is a decision I make on client work.
 12345
- Revenue this month sits top left, where the eye lands first, because it is the number leadership asks about. In an Arabic dashboard it sits top right.
- The target is a dashed line across the trend.
- Each bar carries its own name and value, so there is no legend to match colors against.
- South is the only dark bar because it is the only region behind plan.
- This screen holds three views. The detail tables sit on a second tab, out of leadership's way.
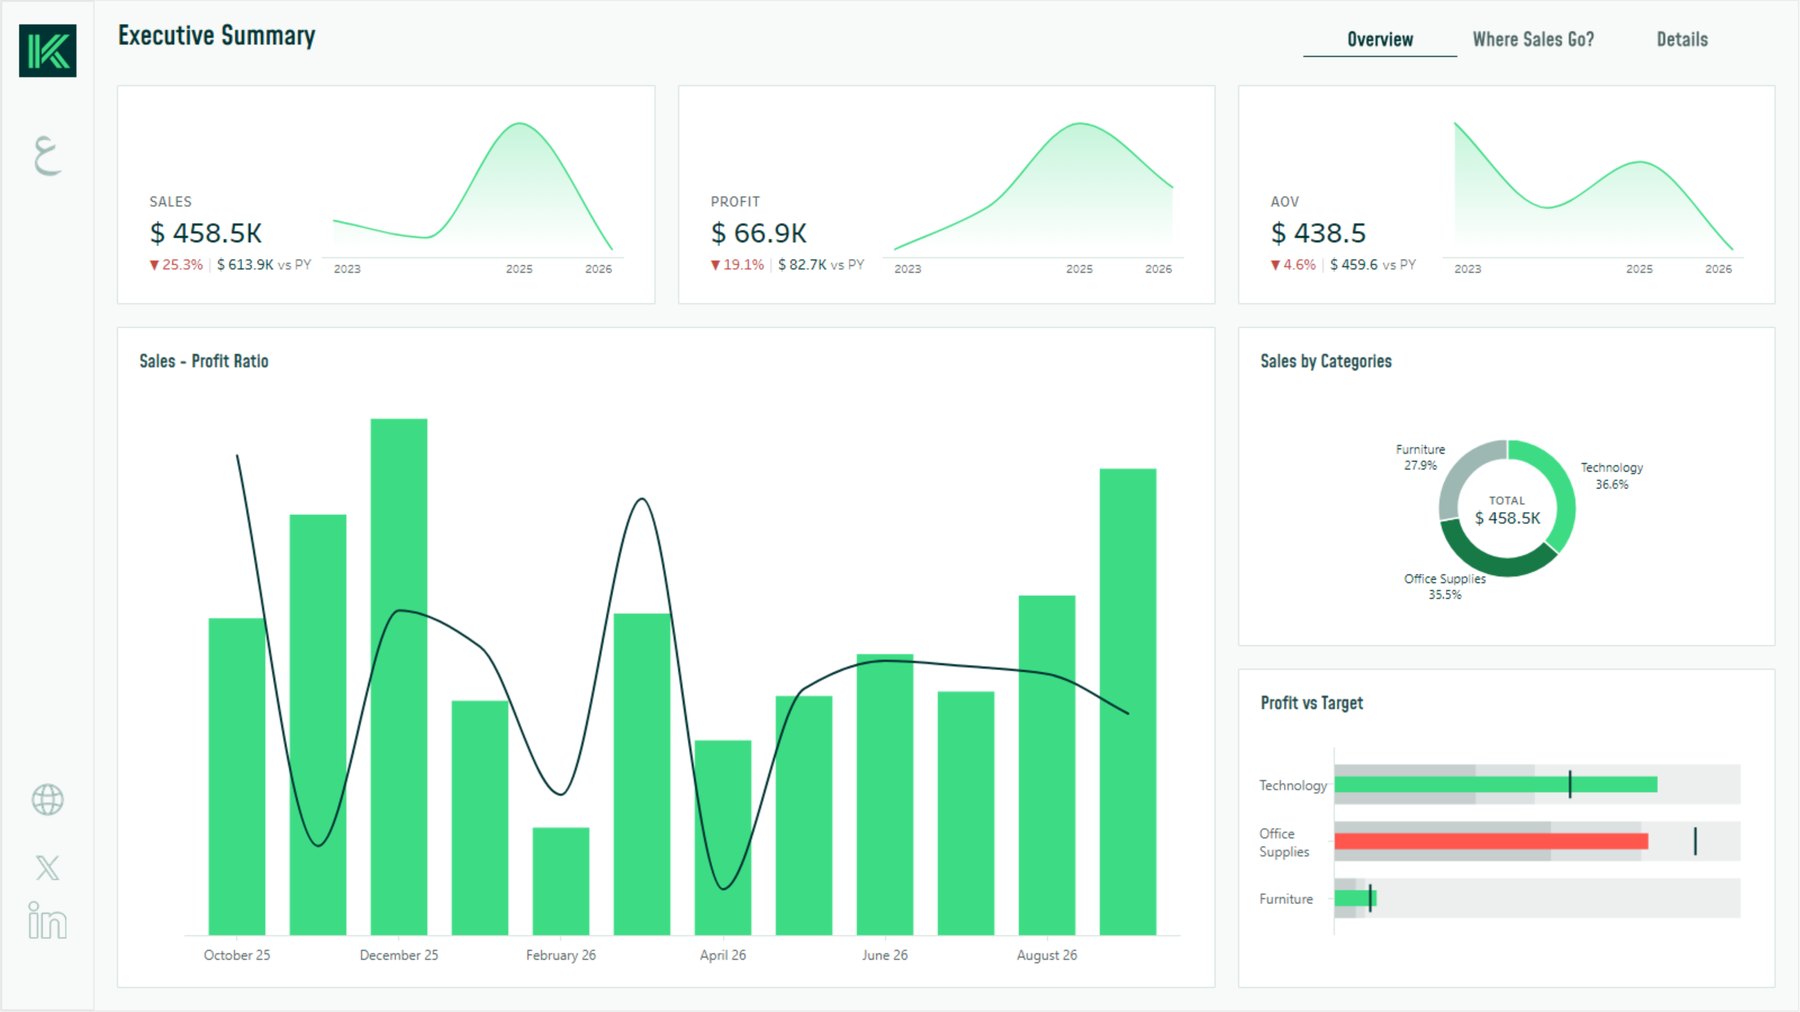
The same decisions are in Executive Summary, built entirely with Klimn extensions.
How I build it
It starts with requirements. I sit with the people who will read the dashboard and agree which decisions it has to support. Then I check what your tables hold, and the owner of the numbers agrees how each metric is calculated, so "revenue this month" means one thing to everyone.
A wireframe and then a working prototype settle what goes where before the full build. I revise it with the readers until it works for them.
With your Tableau admin I set permissions and row-level security, so a regional manager sees only their region. Your team gets the workbook and notes on the data model. Once live, I check who opens it and fix what keeps people away. A Klimn Tamkeen course on the same data can follow.
Consulting for your Tableau team
Bring me in for the work in front of your team, including a second opinion before a build starts. Say a dashboard nobody opens any more: I find out who stopped and why, and tell you what to fix first. Bring me in